
Eighteen Hours of Credits and the Panel Behind Them
Eighteen hours is a long enough window to see whether an account is behaving. At 1 PH/s the pool credits 0.000018692 BTC an hour, so the total reaches 0.00033645 BTC by hour eighteen, about $28.49 at $84,692. Those credits should agree with the hashrate a pool reports, and when they do not, the gap usually explains itself faster than a support ticket does.
Key takeaways
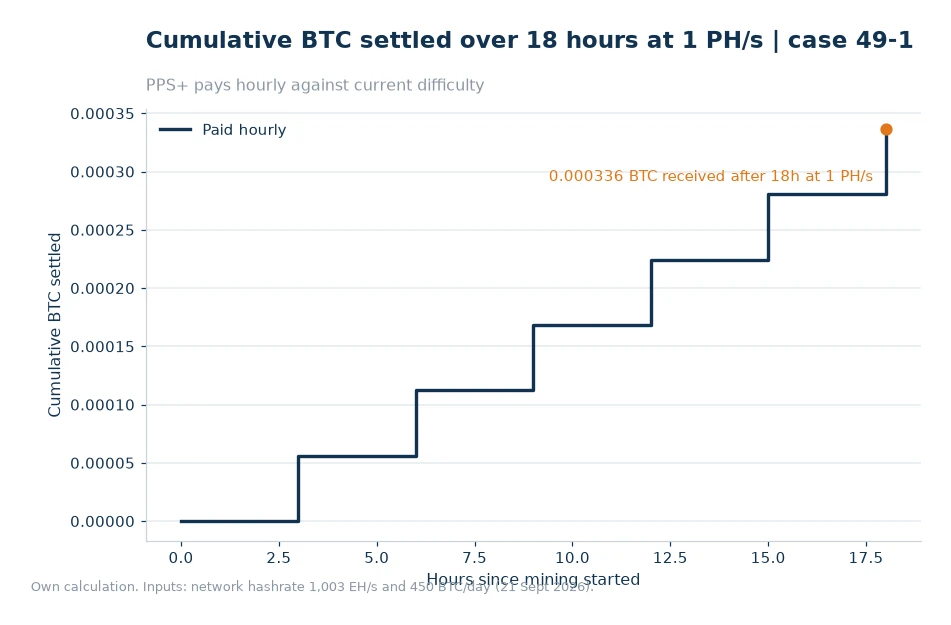
- 1 PH/s credits 0.000018692 BTC an hour, or 0.00033645 BTC across 18 hours.
- Each three-hour checkpoint adds 0.00005608 BTC, so the staircase is even until difficulty moves.
- Pool hashrate and network hashrate are different denominators and answer different questions.
- A reported hashrate that lags the spec by more than a few percent deserves a check on the miner, not the pool.
What the panel is actually measuring
A pool statistics view mixes three families of number. The first describes the pool: how much hashrate it holds, how many miners are connected, how its luck has run. The second describes the network: total hashrate, difficulty, block subsidy. The third describes your account, and it only appears after you sign in. Reading them in that order prevents the common mistake of treating a network figure as a personal one.
The Pool Hashrate number is the pool's own contribution, and dividing it by the network total gives the share of blocks the pool can expect to find. Your credit is a different calculation: your shares divided by the pool's shares, multiplied by what the pool earned. Both matter, and neither can be read off the other without the step in between.
Miners connected is the softest of the numbers, because it counts accounts rather than machines and a single operator can hold several. Treat it as a sign of scale, not as a measure of anything you can act on. The same caution applies to totals that span every coin the pool supports: they tell you the business is busy, not that your BTC account is healthy.
Eighteen hours at three-hour checkpoints
The run below holds 1 PH/s and a constant difficulty. The final column shows how much of the total had arrived at each checkpoint, which is the quickest way to see whether a gap in the series is real or imagined.
| Checkpoint | Cumulative BTC | USD at $84,692 | Share of total |
|---|---|---|---|
| 3 hours | 0.00005608 | $4.75 | 16.7% |
| 9 hours | 0.00016823 | $14.25 | 50.0% |
| 15 hours | 0.00028038 | $23.75 | 83.3% |
| 18 hours | 0.00033645 | $28.49 | 100% |
The halfway point at nine hours is the useful benchmark. If an account shows 0.00016823 BTC at hour nine, the run is on track. If it shows less, either the hashrate is under what you think it is or the window included an interruption. Both are visible in the miner's own log, which is why the panel is a starting point rather than a verdict. A single checkpoint that arrives a little late is worth noting; only a trend across several of them justifies changing anything.
Worked example
Six steps take the network totals to the eighteen-hour figure.
- Network output: 3.125 BTC × 144 blocks = 450 BTC a day.
- BTC per TH/s: 450 ÷ 1,003,107,267 = 0.00000044861.
- 1 PH/s is 1,000 TH/s: 1,000 × 0.00000044861 = 0.00044861 BTC a day.
- Hourly: 0.00044861 ÷ 24 = 0.000018692 BTC, shown as 1.869e-05 on the chart.
- Three hours: 3 × 0.000018692 = 0.00005608 BTC, or $4.75.
- Eighteen hours: 18 × 0.000018692 = 0.00033645 BTC, and 0.00033645 × 84,692 = $28.49.
- Nine hours sits exactly halfway: 0.00033645 ÷ 2 = 0.00016823 BTC.
Why a hashrate estimate lags
Reported hashrate is inferred from shares, not measured at the PSU. Shares arrive in a random pattern, so any short window produces a noisy estimate, and a restart resets the pattern. A machine that has been running for ten minutes can show half its rated hashrate without anything being wrong, which is why comparisons should use windows of hours rather than minutes.
The same logic applies to a pool's own figures. A pool's hashrate moves as miners join and leave, and its luck varies with the blocks it finds. On 21 Sept 2026 the network was running about 1,003 EH/s with difficulty at 132.76 T and an estimate of −2.12% for the next adjustment. Those three numbers set the frame in which every account-level figure should be read.
Share difficulty adds one more layer. When the pool raises the difficulty of the shares it accepts, fewer but heavier shares arrive, and a raw count of them falls even though the underlying hashrate has not changed. If a dashboard shows share counts, look at the hashrate estimate beside them rather than at the count alone.
Reading a statistics page without over-reading it
Start with the ViaBTC Mining Statistics view, which puts pool hashrate, network hashrate and difficulty on one screen. Take the three numbers as context, then open your own account view and compare the credit series with the arithmetic above. If the two agree within a few percent over eighteen hours, nothing needs attention.
The pool state page is the second stop, because luck and hashrate together explain why a pool's block count differs from a naive estimate. A pool with a lower share of network hashrate finds fewer blocks, and that is a property of its size rather than a fault. Nothing on either page predicts the next block.
What luck does to the pool totals
A pool finds blocks by chance in proportion to its share of network hashrate, so any given day can land above or below the long-run expectation. That is why a statistics page reports luck as a separate figure instead of folding it into hashrate. A pool can hold a steady share of the network and still have a thin week, and the reverse is equally true.
Under PPS+ the miner is insulated from that variance, because the block-reward component is settled per share against current difficulty rather than per block found. Under PPLNS the miner carries a slice of it across the last five difficulty rounds. Reading luck is therefore informative about the pool's recent history and, for a PPS+ account, close to irrelevant to the credit on screen. Knowing which of the two applies saves a lot of unnecessary worry.
Frequently asked questions
How much does 1 PH/s credit in 18 hours?
0.00033645 BTC, which is about $28.49 at $84,692, because the hourly rate is 1.869e-05 BTC and 18 hours of it accumulate at a constant difficulty.
What does the Pool Hashrate figure tell me?
It is the pool's own share of network hashrate, so dividing it by the network total gives the pool's chance of finding the next block, which is a different number from your payout.
Why does reported hashrate lag the specification?
Estimates are built from submitted shares over a window, so a restart or a share drought pulls the figure down for a while before it recovers.
Check the halfway point first
Eighteen hours is short enough to remember and long enough to be meaningful. Note the credit at hour nine, note it again at hour eighteen, and keep both next to the pool's hashrate for the day. A series that tracks the arithmetic is the strongest evidence you will get that the machine, the account and the panel are describing the same operation.
If the two diverge, work backwards in the order of the table: hashrate, then interruption, then difficulty. The Miner Profitability Ranking is a reasonable final check, since it shows where a model sits against others at current difficulty and price, and a model that has fallen behind the field is a hardware question rather than a pool one.
Sources: the ViaBTC statistics, pool state and miner pages for panel definitions and the listed rates[1]. Inputs read 21 Sept 2026: 1,003 EH/s network hashrate, 132.76 T difficulty, 3.125 BTC subsidy, 144 blocks a day, BTC $84,692, next adjustment estimate −2.12%. Published 22 Oct 2026.